
Roma, 31 marzo 2021 – Per quantificare l’esposizione al rischio tsunami che grava sulle coste del Mediterraneo, negli ultimi anni un team internazionale di ricercatori ha realizzato il primo Modello di pericolosità da tsunami generati da terremoti per l’intera area NEAM (Oceano Atlantico nord-orientale, Mar Mediterraneo e mari connessi fino al Mar Nero), denominato NEAMTHM18 (NEAM Tsunami Hazard Model 2018).
Questo modello è frutto del Progetto Europeo TSUMAPS-NEAM, coordinato dall’Istituto Nazionale di Geofisica e Vulcanologia (INGV) e finanziato dalla Protezione Civile Europea (DG-ECHO).
NEAMTHM18 è di particolare interesse per l’Italia poiché è stato utilizzato come base per la pianificazione di protezione civile sulle nostre coste, nonché per la gestione dell’evacuazione della popolazione in risposta ad una eventuale allerta tsunami diramata dal SiAM, il Sistema di Allertamento nazionale per i Maremoti generati da eventi sismici cui è parte il Centro Allerta Tsunami dell’INGV (CAT-INGV).
Infatti, lo scorso 18 marzo al largo della Sardegna e delle Isole Baleari si è rilevato uno tsunami di modeste dimensioni, conseguenza del terremoto di magnitudo 6.2 registrato dalla Rete Sismica Nazionale dell’INGV al largo delle coste dell’Algeria.
Questo tsunami, tra l’altro, non è stato l’unico verificatosi nell’area del Mediterraneo. Solo pochi mesi prima, il 30 ottobre 2020, un terremoto di magnitudo 7.0 con epicentro a Samos in Grecia, ha provocato uno tsunami a Samos e Smirne causando danni sia in Grecia che in Turchia dove, oltretutto, si è registrata una vittima proprio a causa del maremoto.
“Nel modello NEAMTHM18, il calcolo della pericolosità da tsunami per le coste oggetto dello studio è stato strutturato in quattro fasi: lo sviluppo del modello probabilistico sul verificarsi di un terremoto; la simulazione numerica della generazione e propagazione delle onde di tsunami in mare aperto; la modellazione statistica della probabilità di inondazione delle coste analizzate; l’aggregazione dei diversi stadi finalizzata alla quantificazione delle curve di pericolosità”, spiega Roberto Basili, coordinatore del progetto TSUMAPS-NEAM per l’INGV e primo autore dell’articolo pubblicato sulla rivista scientifica ‘Frontiers’.
Le curve di pericolosità forniscono una stima della probabilità che uno tsunami di diverse altezze colpisca in futuro le coste dell’area NEAM. Il modello viene presentato esprimendo anche l’incertezza che caratterizza queste stime di pericolosità, con una sorta di “barra di errore” per ognuno dei valori di probabilità stimati.
“Va ricordato, infatti, che i valori di pericolosità riportati nel modello NEAMTHM18 sono stati quantificati mediante una tecnica di modellazione che ha tenuto conto anche di dati e approcci fra loro alternativi, seguendo un processo decisionale strutturato basato su un protocollo che ha permesso di integrare in maniera trasparente i pareri di esperti di differenti discipline, che sono l’espressione di limitazioni dei dati disponibili e di opinioni diverse nell’ambito della comunità scientifica – aggiunge Basili – Il modello fornisce dunque una ‘famiglia’ di curve di pericolosità rappresentata dal valore medio e dai vari percentili della cosiddetta ‘incertezza epistemica’, ovvero legata al nostro livello di conoscenza del fenomeno in questione”.
“Le scelte effettuate dal DPC per formulare le indicazioni per la pianificazione costiera hanno tenuto conto di queste incertezze e introdotto di conseguenza dei ‘fattori di sicurezza’ – prosegue il ricercatore – Inoltre, come riferimento per la pianificazione, sono stati identificati, come già fatto dalla Nuova Zelanda, gli eventi con tempo di ritorno medio di 2.500 anni. Questa scelta riflette il fatto che gli tsunami sono eventi relativamente rari ma con la capacità di causare gravi conseguenze. È da notare che questo tempo di ritorno medio è maggiore di quello di 475 anni considerato dalla normativa sismica, che è riferita a eventi più frequenti”.
Nella definizione e nel calcolo delle curve di pericolosità sono stati presi in esame 2.343 punti di interesse distribuiti lungo le coste del NEAM a una distanza media di circa 20 chilometri l’uno dall’altro. A partire da queste curve, si possono realizzare mappe di probabilità per diversi livelli di altezza massima di inondazione e mappe di pericolosità relative al periodo di ritorno medio del maremoto. Alcuni esempi, insieme alla necessaria documentazione, sono riportati nel sito web del modello e sono consultabili attraverso uno strumento interattivo dedicato.
Dall’analisi delle curve di pericolosità emerge che nell’area NEAM sono possibili valori dell’inondazione di alcuni metri. “In particolare, nel 37% dei punti in cui è stata calcolata la pericolosità nel Mar Mediterraneo potrebbe verificarsi, mediamente ogni 2.500 anni, un evento che supera un’altezza di inondazione di un metro. I punti dove si potrebbero avere più frequentemente altezze anche maggiori si trovano sulle coste libiche, egiziane, cipriote e greche, nonché sulle coste italiane del Mar Ionio. Nell’Atlantico nord-orientale, i punti caratterizzati da una pericolosità relativamente elevata si trovano sulle coste della Mauritania e del Golfo di Cadice. Nell’intera area NEAM, quindi considerando anche le coste del Mar Nero e dell’Oceano Atlantico, le aree in cui si possono avere, nello stesso intervallo di tempo, altezze dell’inondazione superiori a un metro corrispondono al 30% dei punti analizzati”, conclude Basili.
Il modello NEAMTHM18 rappresenta dunque un primo importante passo per avviare valutazioni locali più dettagliate della pericolosità e dei conseguenti rischi da inondazioni generate da tsunami nell’area NEAM, essendosi già posto come punto di partenza per contribuire alla progettazione di mappe di evacuazione per il sistema di allertamento nazionale per i maremoti.
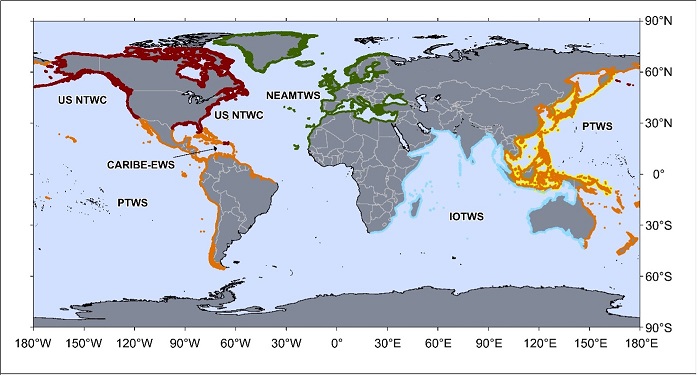
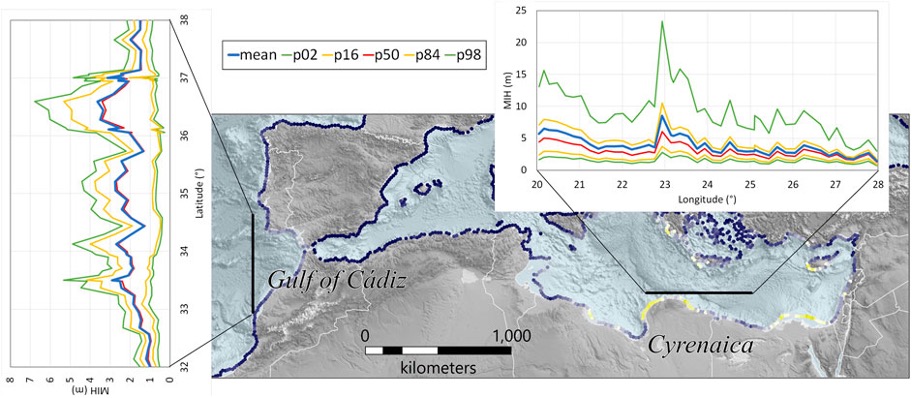
Fig. 1 – Distribuzione globale, aggiornata nel 2015, delle aree coperte dai sistemi di allertamento tsunami (TWS) come stabilita dal Gruppo di Coordinamento Intergovernativo (ICG) della Commissione Oceanografica Intergovernativa dell’UNESCO. Con i diversi colori sono rappresentati i vari organismi competenti nelle diverse aree: Stati Uniti in rosso scuro, Oceano Indiano in azzurro, Oceano Pacifico e Caraibi in arancione, Pacifico nordoccidentale in giallo e l’Oceano Atlantico nord-orientale, Mar Mediterraneo e mari connessi fino al Mar Nero in verde scuro. Sull’area di quest’ultimo è stato sviluppato il modello di pericolosità NEAMTH18.
Fig. 2 – Esempi di profili dell’altezza massima di inondazione (MIH in metri) lungo le coste con i valori più alti della pericolosità nel modello NEAMTH18. Il profilo orientato in senso nord-sud rappresenta le coste del Golfo di Cadice mentre quello orientato in senso est-ovest rappresenta le coste della Cirenaica. Entrambi fanno riferimento al modello di pericolosità con periodo di ritorno medio di 2500 anni e con i diversi colori riportano le MIH per il valore medio (blu) e per i diversi percentili dell’incertezza epistemica (rosso: 50°; giallo: 16° e 84°; verde: 2° e 98°).
*******
NEAMTHM18, the first tsunami hazard model for the Northeast Atlantic, the Mediterranean Sea and connected seas is online
The first hazard model for tsunamis generated by earthquakes in the NEAM area, the result of a European project coordinated by INGV, has been realized
Rome, March 31, 2021 – To quantify the tsunami risk for the Mediterranean coasts, an international team of researchers brought about the first earthquake-generated tsunami hazard model for the whole NEAM area (Northeast Atlantic Ocean, Mediterranean Sea, and connected seas up to the Black Sea).
This model, named NEAMTHM18 (NEAM Tsunami Hazard Model 2018), is the main product of the European Project TSUMAPS-NEAM, coordinated by the National Institute of Geophysics and Volcanology (INGV).
NEAMTHM18 is of particular interest for Italy, because it has been used as a basis for Civil Protection planning along the coasts of the country, also to manage public evacuation in response to a possible tsunami alert issued by the “SiAM”, the National Warning System for Tsunamis generated by seismic events to which the Tsunami Alert Center of INGV (CAT-INGV) is part.
In fact, last March 18, offshore Sardinia and the Balearic Islands a moderate-sized tsunami was detected, due to the 6.2 magnitude earthquake recorded by the INGV National Seismic Network offshore the Algerian coast.
Moreover, this tsunami wasn’t the only one that occurred in the Mediterranean area. Just a few months earlier, on October 30, 2020, a 7.0 magnitude earthquake with the epicenter in Samos, Greece, produced a tsunami in Samos and Izmir, causing damage both in Greece and Turkey where, moreover, a fatality was recorded due to the tsunami.
“In the NEAMTHM18 model, tsunami hazard calculation for the studied coasts was structured in four stages: the development of the probabilistic model of earthquake occurrence; the numerical simulation of tsunami wave generation and propagation in the open sea; the statistical modeling of the inundation probability; the aggregation of the different stages aimed at quantifying hazard curves”, Roberto Basili, Coordinator of the TSUMAPS-NEAM project for INGV and first author of the paper, explains.
The hazard curves provide estimates of the probability that a tsunami of different heights will strike the NEAM coast in the future. The model is presented by also expressing the uncertainty that characterizes these hazard estimates, with a sort of “error bar” for each of the estimated probability values.
“Indeed, it is worth recalling that the hazard values presented in the NEAMTHM18 model were quantified using a modeling technique that considered alternative data and approaches, following a formalized decision-making process based on a multiple-expert protocol. This procedure allowed us to transparently integrate the experts’ opinions from different disciplines, which are the expression of limitations of available data and their different interpretations within the scientific community – Basili adds – Therefore, the model provides a family of hazard curves represented by the mean value and various percentiles of the so-called epistemic uncertainty, that is the uncertainty related to our level of knowledge of the phenomenon in question”.
“The choices made by DPC to formulate coastal planning guidance took these uncertainties into account and introduced ‘safety factors’ accordingly – the researcher continues – Besides, events with an average return time of 2,500 years were identified as a reference for planning, as New Zealand has already done. This choice reflects that tsunamis are relatively rare events with the potential to cause severe consequences. It should be noted that the average return period is greater than the 475-year average return period considered by the building codes for seismic hazard, which refers to more frequent events”.
2,343 points of interest (POIs) distributed along the NEAM coastline at an average spacing of about 20 kilometers were considered in the definition and calculation of hazard curves. Starting from these curves, maps of probability for different levels of maximum flood height (MIH) and hazard maps for different values of the average return period (ARP) can be made. Several examples, including the necessary documentation, can be found on the model website, accessible through a dedicated interactive tool.
Analysis of the hazard curves shows that inundation values of several meters are possible in the NEAM area. “Specifically, in 37% of the hazard locations in the Mediterranean Sea, an event exceeding a 1-meter inundation height could occur on average every 2,500 years. The points where even greater heights could be more frequent are on the Libyan, Egyptian, Cypriot and Greek coasts, as well as on the Italian coasts of the Ionian Sea. In the northeast Atlantic, the points characterized by a relatively high hazard are located on the coasts of Mauritania and the Gulf of Cadiz. In the whole NEAM area, also considering the coasts of the Black Sea and the Atlantic Ocean, in 30% of the analyzed points we can have in the same time interval inundation heights higher than 1 meter”, Basili explains.
While NEAMTHM18 represents the springboard for starting more detailed local hazard assessments and subsequent risk analyses for tsunami-generated inundations in the NEAM area, it has already been used as a basis to help design evacuation maps for the National Tsunami Warning System.
Fig. 1 – Intergovernmental Coordination Groups global area of coverage map of the Tsunami Warning Systems, updated in 2015 by the Intergovernmental Oceanographic Commission of UNESCO. NEAMTWS (green). US NTWC, US national tsunami warning center (brownish red); IOTWS, Indian ocean tsunami warning and mitigation system (turquoise); PTWC, pacific tsunami warning center (orange); CARIBE-EWS: interim of PTWC and US NTWC; PTWS: Northwest Pacific Tsunami Advisory Center/Japan Meteorological Agency (yellow), PTWC, and US NTWC.
Fig. 2 – Example profiles of the maximum inundation height (MIH; mean and the epistemic uncertainty represented by the 2nd, 16th, 50th, 84th, and 98th percentiles) along coastlines among those with the highest hazard of the NEAM Region. The two profiles span coast of the Gulf of Cadiz (N–S) and the Cyrenaica (E–W). Both profiles are with reference to the hazard model with the 2% probability of exceedance in 50 years (average return period of 2,475 years). The color scale in the map is as in Figure 11. Topo-bathymetry is from the ETOPO1 Global Relief Model (NOAA, 2009; Amante and Eakins, 2009).
 Salva come PDF